

First Sentence Fridays celebrates the prose and process of new books.
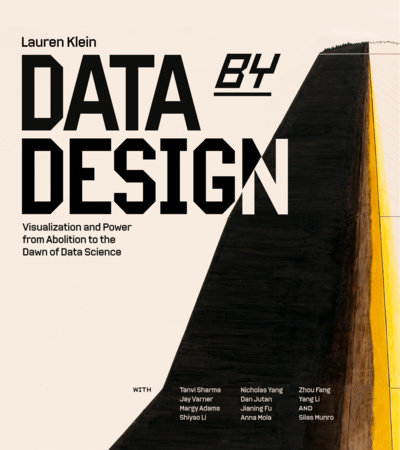
About Data by Design: Visualization and Power from Abolition to the Dawn of Data Science:
From maps of colonial empires to charts of national trade, data visualization has long been used to consolidate knowledge and power. But just as often, it has been used to uncover oppression and bring about change. Data by Design journeys across continents and over centuries to expose the power of visualization—and to show how it can be wielded for good.
A book for those who love charts and graphs, and for those who create them, Data by Design offers historical grounding, ethical clarity, and the inspiration we need to envision a more just future.
Avidly: What’s the first sentence of your book? No cheating!
Lauren F. Klein: “I’ve always loved charts.”
What’s something specific you remember about writing this sentence? Where were you? When in the book writing did you write it?
It’s so simple, but I agonized over it so much! Should I say “charts” or “visualization”? Should I put it in the past tense or present? Would people think that I was ripping off that amazing Tumblr from 2012? Was the fact that I even remembered a Tumblr from 2012 a sign that I was old and irrelevant? Should I have spent more time on TikTok instead? Several hours/days/weeks later and then, of course, the obvious: should anyone be spending more time on TikTok?! In short, I was spiraling!
Can you share an early draft of this sentence? Or tell us about a favorite word, something you wrestled with, some way it changed?
Here’s the first version:
“For as long as I can remember, I’ve been captivated by charts.”
But then it was pointed out to me—by multiple people, mostly kindly—that “For as long as I can remember” was not very far removed from “Since the dawn of time,” which as anyone who has ever taught expository writing, or read expository writing, knows is probably the most clichéd opening line that can be. So I channeled my inner Benjamin Franklin and whittled away. My file history reveals that there were twelve drafts.
Is there a writing tic you wrestled in this book? How did you manage it? Or, is there a style/voice thing you really tried for?
Oh I have writing tics for sure. But the hardest thing with this book, I think, was that I wrote it over a twelve-year span. So certain chapters—the ones on William Playfair and Elizabeth Palmer Peabody come to mind—were first written in a very formal, dotted-Is-and-crossed-Ts academic style, which was how I thought I should write a book before I had ever written a book—and also how I thought I should write a book that would get me tenure. But then I ended up turning my dissertation into my tenure book, and then I wrote Data Feminism.
So by the time I came back to Data by Design, I had a very different set of goals for my readership, and—to be honest—a lot more confidence in my own style and voice. I think the introduction, which I fully rewrote just before I submitted the manuscript for production, best captures the tone (and also the breadth) that I would have liked the rest of the book to have. But I did not want to spend another twelve years rewriting the whole thing!
Tell us one or two specific details about how you like to write: home/office/café, soundtrack or silence, favorite mug, favorite hoodie, preferred mode of pencil/pen/notebook/font/software?
How I like to write is: get the kids out of the house, drink one to two cups of incredibly strong coffee, and then write in an extremely caffeinated state for several hours until I crash. My favorite mug is this NSFW one from The Rumpus, which was a gift from a dear friend as I was finishing my dissertation. My favorite hoodie is from this Walter Benjamin-inspired distillery (!) called Art in the Age. IYKYK.

Tell us one other thing you worked hard on in this book and are proud of!
The website! There is a whole website at dataxdesign.io, which was designed and implemented by the students in my research group (and additional staff members from Emory’s Center for Digital Scholarship and occasional consulting from Polymode) which was the original inspiration for the book.
Now that it’s all written and done, what occurs to you about how your first sentence connects to the book as a whole? In the ideas, style, experience?
One thing that really solidified for me as I finished the book, in the early days of the second Trump administration and DOGE and the attacks on DEI and the increasingly visible collusion of the federal government and Big Tech, is what I saw (and still see) as the crucial importance of critique in guiding us towards a better future.
Outside of the humanities, critique is often viewed as purely negative. But critique, in most cases, comes from a truly generative place. We examine the past, and scrutinize historical records, and perform our interpretations, and construct the arguments that we do, because we want to better understand how we have arrived at this place, and in so doing, allow ourselves to make more informed decisions about the future.
In the epilogue, I say this explicitly. But in that first line, I think I was trying to convey that I really do love charts! And this whole book, even though it delves into the history of colonialism and capitalism and slavery—and in fact links the emergence of modern data visualization to those larger structures and systems—is truly intended as a generative contribution to the field. Some readers may still find it hard to separate the darkness of the specific historical context from the optimism that I have about the future possibilities for the field, but with that first line, I was making my loyalties clear!
What’s your favorite sentence in the book? What specifically do you like about it?
It’s the second sentence in this passage, from p. 15 of the intro, but you need the first sentence to make sense of it, so I’ll quote both:
“And now, nearly four hundred and fifty years after its creation, the “Mapa de Teozacoalco,” as it has come to be called, exemplifies the central argument of this book: that visualization is a tremendous form of power. This is true both because of the knowledge that visualization helps to surface, and because of the people who decide how to put that knowledge to use.”
What I like about it is how it neatly wraps up the first layer of the argument I make about the first chart in the book. One of my favorite things to do as a writer is to make my arguments in layers: tell the first part of a story, end with an assertion about it; tell the next part, end with an assertion that builds off the first; tell the next part, extend the argument further; and so on and so forth. Mapping out these interpretive beats is probably the most pleasurable part of the writing process for me—or at least it is after I’ve figured them all out. I only decided to lead with the “Mapa de Teozacoalco” late in the revision process, but by the time I’d finished my background research on the map, I knew the story had all of the pieces. I remember writing this sentence so easily because the significance of the map was so clear in my mind. It does exemplify the central argument of the book. Zing!
Share the love: what’s a first sentence written by someone else (any genre!) that you think is great?
I have to go with the first line of the first chapter of my partner-in-crime Greg Zinman’s next book:
“On a Friday night, or maybe a Tuesday—who can remember?—in the spring of 1983, New York University film major Ben Salzman was preparing to do his first-ever VJ set in the Video Lounge at Danceteria.” It goes on from there. The whole first paragraph is great!
He’s finishing up the book now, but you can read the chapter in JCMS here.
Order Data by Design from MIT Press now: Out October 20!
Lauren Klein is Professor of Data & Decision Sciences and English at Emory University, where she directs the Digital Humanities Lab and the Atlanta Interdisciplinary AI Network. Before moving to Emory, she taught in the School of Literature, Media, and Communication at Georgia Tech.
Lauren works at the intersection of data science, data ethics, and American culture, with an emphasis on issues of gender and race. She has designed platforms for exploring the contents of historical newspapers, modeled the invisible labor of women abolitionists, and recreated forgotten visualization schemes with fabric and addressable LEDs. She is the author of An Archive of Taste: Race and Eating in the Early United States (University of Minnesota Press, 2020) and, with Catherine D’Ignazio, Data Feminism (MIT Press, 2020), which was named one of the “must-read books for Spring 2020” by WIRED Magazine. With Matthew K. Gold, she edits Debates in the Digital Humanities, a hybrid print-digital publication stream that explores debates in the field as they emerge. Data by Design is her third book.
Discover more from Avidly
Subscribe to get the latest posts sent to your email.